
Use MER to decide how much total budget to spend, and use ROAS to decide where that budget should go inside your channel mix. Neither metric works alone: both need periodic calibration through incrementality testing or marketing mix modeling, or you risk scaling the wrong programs based on a number that only tells half the story.
TL;DR:
- MER should guide overall budget increases or decreases, while ROAS helps allocate spend among existing campaigns.
- When MER rises and ROAS falls, it indicates top-funnel or organic growth rather than campaign inefficiency needing correction.
- Conflicting signals between MER and ROAS often stem from attribution and tracking issues, requiring diagnostic checks before action.
- Running regular incrementality testing and marketing mix modeling ensures calibration of metrics and accurate assessment of causal impact.
- Pairing MER with causal tests prevents misjudging campaign or channel performance based on potentially biased platform-reported ROAS.
Table of Contents
- What Is MER vs ROAS in Marketing?
- MER vs ROAS Comparison: Which Signal Should You Trust?
- When Should You Use MER vs ROAS?
- How Do You Calculate MER, ROAS, and a-MER?
- Why Do MER and ROAS Give Conflicting Signals?
- How Do You Combine MER, ROAS, and Incrementality Testing?
- Operational Checklist: Dashboards, Ownership, and Thresholds
- What Measurement Habit Actually Protects Your Budget?
- Get Your Measurement Stack Right With Cassandra
- Sources
- FAQ
What Is MER vs ROAS in Marketing?
Marketing Efficiency Ratio (MER) measures total revenue divided by total marketing spend across every channel, for a given period. The formula is simple: take every dollar of revenue the business generated, divide it by every dollar spent on marketing, including retainers, tooling, and production costs if your team chooses to count them. MER is a blended, company-level metric that resists the attribution noise that plagues channel-by-channel reporting, which is exactly why finance teams and CFOs tend to trust it more than platform dashboards.
Return on Ad Spend (ROAS), by contrast, measures attributed revenue divided by ad spend for a specific campaign, channel, or platform. It's built for in-platform optimization: deciding whether to push more budget into Meta prospecting or pull back on a Google Shopping campaign that stopped converting. The catch is that ROAS depends entirely on whichever attribution model and lookback window the ad platform uses, so the same campaign can show a 3x ROAS in Meta's dashboard and a 1.8x ROAS in a third-party tool.
A few adjacent terms matter here, and teams that skip defining them tend to argue past each other in budget meetings:
- Blended ROAS is often used interchangeably with MER, but the two aren't guaranteed to match unless you fix the denominator the same way every time, deciding whether agency fees and production costs count as marketing spend.
- a-MER (acquisition MER) isolates new-customer revenue against acquisition spend, stripping out the returning-customer revenue that can make a struggling prospecting engine look healthy.
- Contribution-margin MER swaps revenue for gross margin dollars in the numerator. This is the version CFOs actually care about, since revenue-based MER can improve while profit quietly declines if you're buying growth at the cost of margin.
MER vs ROAS Comparison: Which Signal Should You Trust?
MER answers "is the business efficient overall?" ROAS answers "is this specific channel or campaign pulling its weight?" Confusing the two is how marketing teams end up cutting a channel that was actually working, or scaling one that wasn't.
The clean decision rule: use MER when you're deciding whether to raise or lower total marketing investment, and use ROAS when you're deciding how to split budget among channels that are already approved for spend. This is the level-matching principle that eliminates most metric-driven mistakes: name the decision first, then pick the metric that actually answers it.
Where this gets interesting is when the two metrics move in opposite directions. Four scenarios come up constantly in weekly reporting, and each demands a different response:
- MER up, ROAS down: Your top-of-funnel channels or organic and referral traffic are likely picking up slack. Don't panic and cut the channel showing weaker ROAS. Check whether brand search or direct traffic increased, since that often means paid media is generating a halo effect.
- MER down, ROAS up: Individual campaigns look efficient, but something else is dragging down company-wide efficiency, often rising fixed costs, discounting, or a channel outside your reported set (affiliate, influencer, offline) burning budget without matching return.
- Both up: This is the scenario everyone wants, and it usually means genuine incremental growth. It's still worth a holdout test before assuming every channel deserves more budget.
- Both down: Something structural changed. Check for seasonality, a pricing shift, a broken landing page, or a platform algorithm update before reflexively cutting spend.
Pro Tip: When MER and ROAS disagree, resist the urge to trust whichever number looks better. Divergence is a signal to investigate, not a tiebreaker to pick the more flattering metric.
Each metric has a blind spot worth naming outright. MER is a lagging indicator. It tells you what already happened across the whole business, but it can't tell you which specific campaign to cut or scale next. ROAS is faster and more granular, but it's only as reliable as the attribution model behind it, and that model is controlled by the ad platform, not by you. Treat ROAS as a hypothesis about performance, not a verified fact, until you've checked it against something less biased.
When Should You Use MER vs ROAS?
Different roles in a marketing organization need different answers from the same data, and handing a media buyer a MER report (or handing a CFO a Meta ROAS screenshot) is a common source of friction between finance and performance teams.
- CMOs and finance leaders ask "should we raise or lower total marketing spend next quarter?" MER, ideally the contribution-margin version, is the right input. It reflects what the business actually banks, not what one platform claims to have driven.
- Media buyers and performance marketers ask "which campaign or ad set deserves more budget this week?" ROAS, viewed at the campaign and ad-set level, is the correct lens. Pair it with ad spend analysis to catch creative fatigue before it tanks efficiency.
- Growth leads ask "is our acquisition engine actually working, or just running on returning customers?" a-MER, segmented by new versus returning revenue, answers that question directly.
- CFOs and board members ask "are we buying growth at the expense of margin?" Contribution-margin MER, tracked quarterly against revenue-based MER, exposes that gap fast.
Cadence matters as much as ownership. Track MER weekly for budget health, track platform ROAS weekly by campaign for tuning decisions, review a-MER monthly to catch acquisition drift, and run incrementality or MMM experiments quarterly to recalibrate whatever attribution assumptions have crept in. The handoff point between performance and finance teams should happen at the a-MER review: performance marketers explain channel-level movement, and finance translates that into the contribution-margin conversation the CFO actually needs.
How Do You Calculate MER, ROAS, and a-MER?
The formulas are straightforward, but the inputs are where teams get sloppy. Fix your definitions before you run the numbers, and keep them frozen for the entire reporting period, since redefining spend or revenue mid-period breaks every comparison you try to make later.
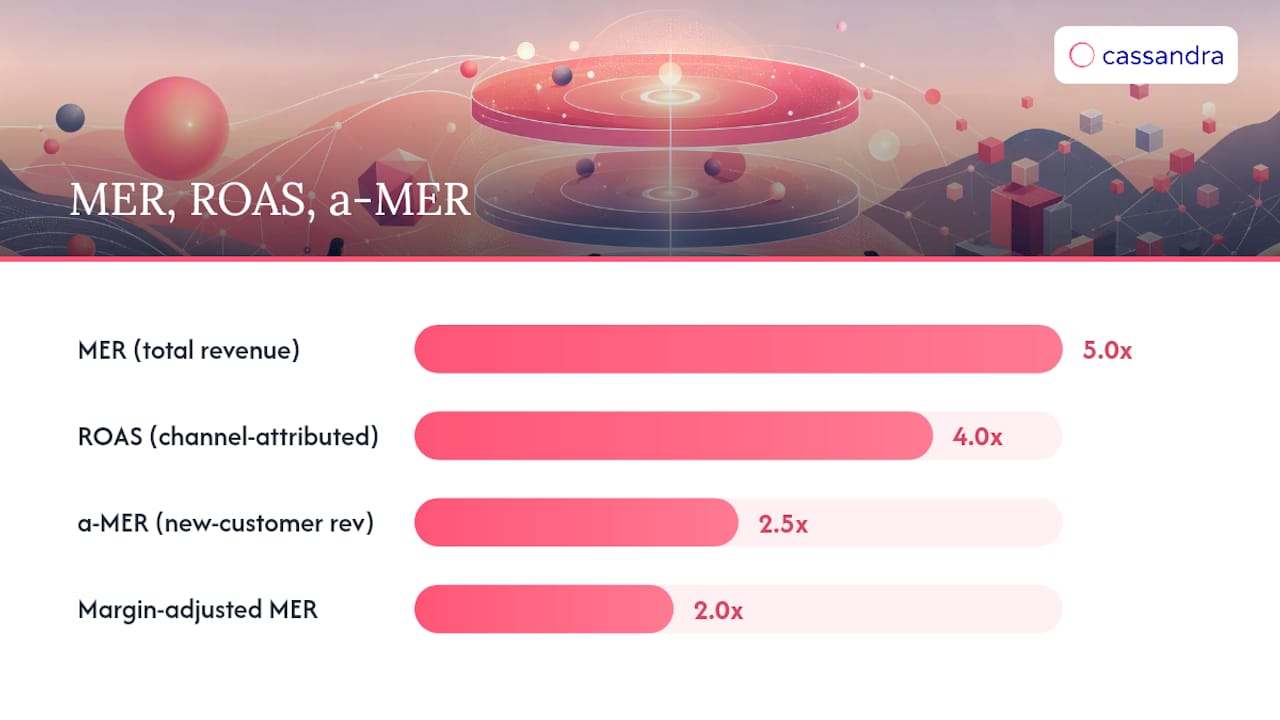
- Calculate MER: total revenue ÷ total marketing spend. If revenue is $500,000 and marketing spend (all channels, all fees) is $100,000, MER is 5.0x.
- Calculate ROAS: attributed revenue ÷ ad spend for a single channel. If a Meta campaign drove $40,000 in platform-attributed revenue on $10,000 of spend, ROAS is 4.0x for that campaign alone.
- Calculate a-MER: new-customer revenue ÷ acquisition spend. If $150,000 of that $500,000 in total revenue came from first-time buyers, and $60,000 of the $100,000 marketing budget went toward acquisition channels, a-MER is 2.5x, a very different number from the blended 5.0x MER, and a much more honest read on prospecting health.
- Convert to contribution-margin MER: replace revenue with contribution margin. If that $500,000 in revenue carries a 40% contribution margin after cost of goods and variable fulfillment costs, contribution margin is $200,000, and margin-adjusted MER becomes 2.0x instead of 5.0x.
That gap between a 5.0x revenue-based MER and a 2.0x margin-adjusted MER isn't a rounding error. It's the difference between a business that looks efficient on a spreadsheet and one that's actually generating profit, and it's why Cassandra's guidance on measurement techniques leans on margin over raw revenue whenever the underlying question is about profitability rather than top-line growth.
DTC brands operating at scale often cite MER benchmarks in the 3x to 5x range as healthy, though the right number depends heavily on margin structure and category. ROAS benchmarks vary by funnel stage, with prospecting campaigns generally running lower and remarketing running higher, so comparing a cold-traffic ROAS against a retargeting ROAS as if they're the same metric is a common, avoidable mistake.
Why Do MER and ROAS Give Conflicting Signals?
Most of the confusion between these two metrics traces back to measurement artifacts, not real changes in performance, and telling the two apart is a skill worth building on your team.
Platform double-counting is the biggest offender. Meta, Google, and TikTok each run their own attribution models, and each platform is incentivized to claim credit for as many conversions as possible. A single purchase influenced by three touchpoints can show up as a full conversion in all three platforms' dashboards simultaneously, inflating combined ROAS well beyond what actually happened.
Attribution windows compound the problem. A platform using a 7-day click, 1-day view window will report a very different ROAS than one using 28-day click attribution, even for identical campaigns. Northbeam's research on this distinction notes that ROAS is fundamentally attribution-dependent in a way MER simply isn't, since MER never asks which channel gets credit.
Privacy and tracking changes, like iOS App Tracking Transparency or browser cookie restrictions, can move platform-reported ROAS sharply without any real change in company-level performance. MER stays comparatively stable through these shifts because it doesn't rely on pixel-level tracking to work.
When the two metrics diverge sharply, run this diagnostic in order:
- Check whether attribution windows changed on any platform recently.
- Segment revenue by new versus returning customers to rule out a mix shift.
- Look for organic, direct, or referral traffic changes that paid media isn't getting credit for.
- Confirm no tracking or consent-banner change rolled out in the affected period.
How Do You Combine MER, ROAS, and Incrementality Testing?
The most reliable measurement setups run three layers at once, because each layer answers a question the other two can't. This structure isn't theoretical. It's the practice mature performance teams have converged on after getting burned by attribution-only reporting.
- Weekly MER for company-level budget health, ideally the contribution-margin version when profit is the concern.
- Weekly platform ROAS by campaign for in-platform allocation and bid decisions.
- Quarterly incrementality tests or marketing mix modeling to recalibrate what the first two metrics are actually measuring.
Geo-lift tests and holdout experiments are the only dependable way to know whether spend is driving causal, incremental revenue rather than just claiming credit for sales that would have happened anyway. A geo-holdout, where you pause spend in a set of matched markets and compare results against markets running normally, answers a question neither MER nor ROAS can: what happens if this spend disappears?
Pro Tip: Run an incrementality test before any budget change larger than 20% of a channel's spend. Platform ROAS will tell you a channel looks strong right up until the geo-holdout proves it wasn't driving much beyond what organic traffic would have delivered anyway.
MMM adds a longer-horizon view, modeling the relationship between spend and revenue across months or quarters, which helps explain slower-moving effects like brand-building that a one-week ROAS snapshot will always miss. Cassandra's incrementality testing platform and marketing mix modeling tools are built around exactly this three-layer structure: measurement validation to catch attribution errors, instant geo-experiments to test causality, and MMM to calibrate the whole system on a recurring basis, so budget decisions rest on evidence rather than whichever platform's dashboard looks best that week.
Operational Checklist: Dashboards, Ownership, and Thresholds
Turning this into a habit rather than a one-time audit takes a short, enforceable routine.
- Weekly: Track MER and ROAS by campaign on one shared dashboard, split by new versus returning customer revenue. Performance marketing owns campaign-level ROAS; finance or the CMO owns overall MER.
- Monthly: Review a-MER to catch acquisition drift before it shows up in quarterly numbers, and reconcile contribution-margin MER against revenue-based MER to flag any growing gap.
- Quarterly: Run a scheduled incrementality test or refresh the MMM model, and treat any MER move greater than 15% or any channel ROAS move greater than 25% as a trigger for investigation, not an automatic budget change.
What Measurement Habit Actually Protects Your Budget?
The single habit that saves teams from cutting the wrong program is refusing to act on one metric in isolation. A campaign with a falling ROAS looks like an obvious cut until you realize it's been feeding your retargeting pool and your branded search volume for months. MER would have caught that; the platform dashboard alone never will.
Pair MER with at least one causal test before any major reallocation, especially when the number in front of you is flattering. It's easy to trust a metric that confirms what you already wanted to do. If you want a fast gut-check before running a full audit, Free benchmarking tools can give you a quick read on where your a-MER and margin-adjusted MER stand relative to your category before you commit to bigger structural changes.
— Tools
Get Your Measurement Stack Right With Cassandra
This platform is built for exactly the three-layer stack this article recommends: measurement validation that catches attribution errors before they distort dashboards, instant geo-incrementality testing to prove causality, and marketing mix modeling to calibrate budget decisions across the full channel mix, not just the ones a platform is willing to claim credit for.

If you're tired of debating whether a ROAS drop means a real problem or just a tracking change, that's precisely the gap Cassandra closes. Explore Cassandra's measurement use cases to see how brands across ecommerce, fintech, and nonprofit sectors have used incrementality testing and MMM to stop guessing which channels actually drive growth, then request a demo to get an a-MER calculation and experiment design built around your own numbers.
Sources
FAQ
Is a 4.0x ROAS good?
A 4.0x ROAS is generally solid for many DTC and ecommerce categories, but "good" depends on your margin and funnel stage. A 4.0x ROAS on a low-margin product can still lose money, while the same ratio on a high-margin remarketing campaign can be highly profitable.
What is considered a good MER in marketing?
Healthy MER benchmarks vary by category, and many DTC brands operating at scale cite MER figures in the 3x to 5x range, according to this source. Businesses with thinner margins generally need a higher MER to stay profitable, which is why margin-adjusted MER matters more than the raw revenue-based figure.
Should I use MER or ROAS to decide my overall ad budget?
Use MER for total budget decisions, since it reflects company-wide efficiency and resists the attribution noise that distorts platform-reported ROAS. Reserve ROAS for deciding how to split an already-approved budget across specific channels and campaigns.
How often should I run incrementality tests?
Geo-lift holdouts and MMM refreshes both serve to recalibrate the assumptions behind your reported MER and ROAS numbers.