

A geo lift test measures the causal incremental impact of a campaign by comparing treated geographies to matched controls and reporting incremental lift and iROAS. It's the right move when you have enough regional volume to detect a meaningful effect, the ability to isolate spend by market, and at least six months of region-level KPI history. Expect a design and run window of roughly six to eight weeks total, plus a handful of analyst hours to validate the setup.
TL;DR:
- Geo lift tests are most effective when at least six months of regional KPI data are available and spend can be clearly separated by geography.
- Poor pre-period matching or contamination from national campaigns can lead to biased results, requiring thorough validation and control checks.
- Six to eight weeks is typically needed for the full test cycle, with more markets reducing duration and fewer markets extending it.
- Significance judgments depend on p-values and target iROAS thresholds, with p less than 0.05 indicating statistically significant lift worth scaling.
- Automated platforms like Cassandra streamline test design, power calculation, and reporting, making end-to-end geo lift deployment easier and more accurate.
Table of Contents
- What Is a Geo Lift Test and Why Does It Prove Incrementality?
- When Should You Run a Geo Lift Test Instead of an RCT or MMM?
- How Do You Design and Power a Geo Lift Test Correctly?
- What Does Clean Execution Look Like Once the Test Is Live?
- How Do You Calculate Lift, iROAS, and Statistical Confidence?
- Why Do Geo Lift Tests Fail, and How Do You Fix Them?
- How Cassandra Supports Geo Lift Testing End to End
- Where Geo Lift Fits in Your Measurement Roadmap
- Stop Guessing on Regional Incrementality
- Sources
What Is a Geo Lift Test and Why Does It Prove Incrementality?
A geo lift test splits your markets into treatment and control groups, runs the campaign only in treatment geographies, and measures the gap between what actually happened and what would have happened without the spend. That gap is incremental lift, and it exists because the control group serves as a stand in for the counterfactual, something a platform's own reporting can't give you.
This matters because user-level randomized trials are often impossible for channels like linear TV or out-of-home, where you can't split individual households into test and control. Geo-level experiments sidestep that problem by working at the market level instead.
The counterfactual itself usually comes from a synthetic control method. Augmented Synthetic Control (ASCM) and Generalized Synthetic Control (GSC) build a weighted blend of untreated markets that mimics your treatment geography's pre-campaign behavior. GeoLift's methodology combines both approaches in a two-step process specifically for this reason.
- Treatment geographies receive the campaign; control geographies don't.
- The synthetic counterfactual is only as reliable as its pre-period fit.
- Poor pre-period matching introduces bias no amount of statistical cleverness can fix.
When Should You Run a Geo Lift Test Instead of an RCT or MMM?
Geo lift earns its place when the channel itself resists user-level randomization. TV, CTV, retail media, and cross-device campaigns all fall into this bucket, along with any national line item where platforms can't reliably hold out individual users.
Platform-native holdouts or randomized controlled trials are the better call when a channel genuinely supports user-level randomization, such as certain paid social or email programs. Marketing mix modeling works best as a complement rather than a substitute, since it needs experimental anchors like geo lift results to stay calibrated over time, a point QRY's explainer on geo-lift testing makes directly.
- Geo lift fits channels with regional reporting but no individual-level targeting control.
- It becomes impractical with fewer than a handful of viable regional markets.
- It also struggles when spend can't be cleanly separated by geography (national programmatic buys, for example).
How Do You Design and Power a Geo Lift Test Correctly?
Design starts with data, not markets. Pull at least six months of regional revenue or order data, and pick the KPI that actually reflects the business outcome you're testing, not just the easiest metric to pull.
- Collect and clean regional KPI history. Six months minimum, matched to your primary business metric.
- Match markets on more than geography. Population, baseline demand, category share, and seasonality all need to line up between candidate pairs. Algorithmic matching tools reject weak pairs automatically rather than relying on gut feel; the matched market testing framework covers the criteria in more depth.
- Validate pre-period fit. Compute pre-period RMSE and run AA tests or backtests. Reject any pair that doesn't hold up before you spend a dollar on treatment.
- Run power analysis. Set your minimum detectable effect (MDE) at a business-meaningful threshold, target 80% statistical power, and solve for the number of treatment geographies and weeks needed. More markets shorten the run; fewer markets stretch it out.
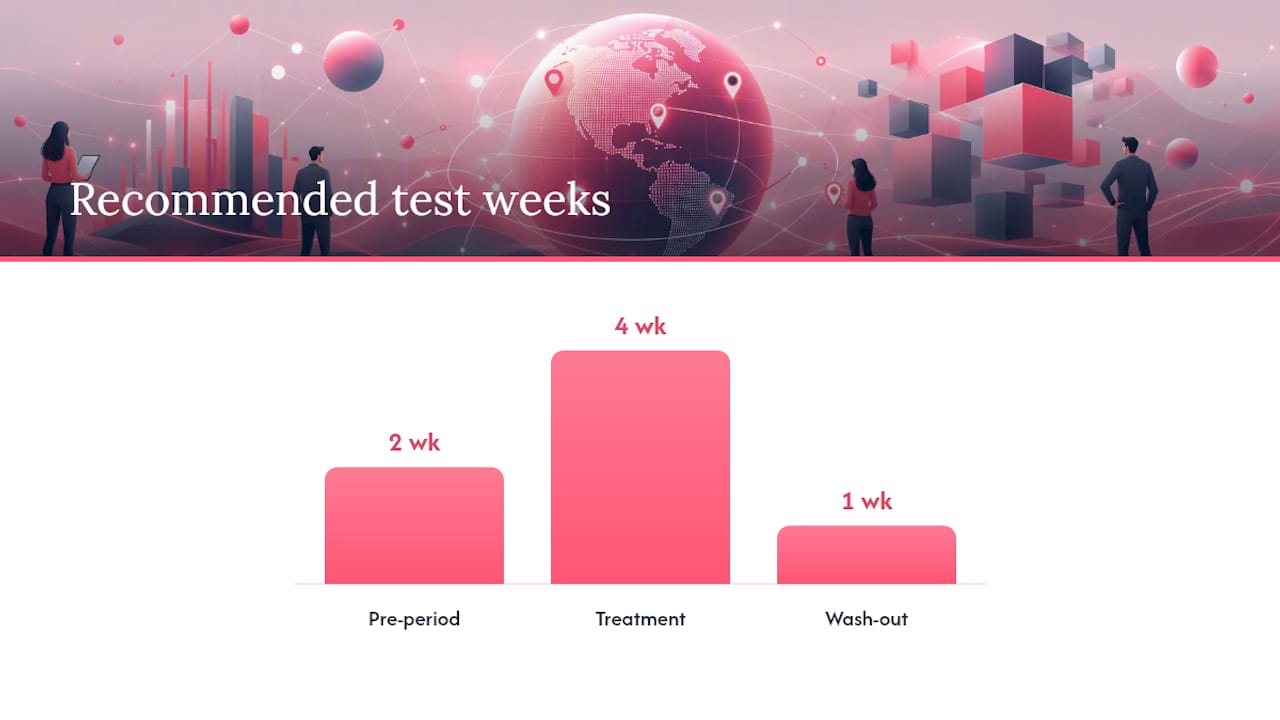
Guidance from d-dat's practical incrementality framework points to roughly six to eight weeks total (two pre-period weeks, four treatment weeks, one wash-out week), with typical MDEs landing between 5% and 15% depending on your baseline variance.
Pro Tip: If your donor pool's pre-period RMSE comes back high, add treatment geographies or extend the run rather than trying to patch it with a statistical correction after the fact.
What Does Clean Execution Look Like Once the Test Is Live?
Execution is where most tests quietly fail. Control geographies need spend removed entirely, and you should check for national programmatic campaigns bleeding into control markets without your knowledge.
- Pull all spend from control geographies before launch, not partway through.
- Keep creative, pricing, and promotions identical across treatment and control. Vary only the channel under test.
- Monitor fill rates and ad delivery logs daily for unexpected spikes that signal contamination.
- Run daily bleed checks rather than waiting for a weekly report to catch a problem.
- Write your stopping rules and pre-registration before launch, including your primary metric and MDE, so no one adjusts the goalposts mid-test.
That last point isn't a formality. Pre-registration as operational discipline is what separates a defensible result from one stakeholders will pick apart later, especially if the outcome doesn't match what leadership hoped to see.
How Do You Calculate Lift, iROAS, and Statistical Confidence?
Lift is the difference between what actually happened in treatment geographies and what your synthetic counterfactual predicted, expressed as both a percentage and a dollar figure. From there, incremental ROAS (iROAS) divides incremental revenue by treatment spend, giving you a return figure that isolates the campaign's actual contribution rather than crediting revenue that would have happened anyway.
Reading the result: A confidence interval and p-value tell you how much to trust the number. Conventional practice treats p < 0.05 as statistically significant, per Fairview's geo-lift glossary, though the decision rule matters more than the threshold alone.
A workable decision framework looks like this: if p is below 0.05 and iROAS clears your target, scale the channel. If p sits between 0.05 and 0.1, treat the result as directional and worth a repeat test rather than a full commitment. If p exceeds 0.1, call it inconclusive and investigate power before drawing any conclusion. The incrementality formula guide walks through the underlying math in more detail.
Why Do Geo Lift Tests Fail, and How Do You Fix Them?
Contamination is the most common failure mode. If control geographies show unexpected lift, check for national campaigns, cross-border retail promotions, or programmatic buys that ignored your geo fencing.
- Poor pre-period fit usually means the donor pool is wrong. Widen the region set, swap the KPI, or add candidate markets before rerunning the match.
- A non-significant result can mean either the true effect is zero or the test was underpowered. Check your realized MDE against your original power analysis before concluding either way.
- Seasonality and one-off events (a competitor launch, a holiday shift) distort results. Extend the pre-period window or reschedule the test rather than pushing through a compromised window.
Pro Tip: A "flat" result during a major seasonal event usually isn't a null finding. It's a sign the test window needs to move.
How Cassandra Supports Geo Lift Testing End to End
Cassandra's geo-lift incrementality testing platform automates the parts of this process analysts spend the most time on: power calculators for sizing treatment geographies, algorithmic market matching, and iROAS reporting once the test concludes. For teams weighing geo lift against other measurement methods, our use cases across industries show how the approach performs in practice, from fashion to nonprofit spend.
Where Geo Lift Fits in Your Measurement Roadmap
Run geo lift annually to validate your core measurement assumptions, and quarterly for your largest channels where budget decisions carry the most risk. Prioritize it over MMM alone whenever you need a hard causal anchor, then use that result to calibrate your MMM rather than treating the model as self-sufficient. My honest recommendation: don't let a clean geo lift result sit in a slide deck. Feed it back into every model that touches that channel.
— Tools
Stop Guessing on Regional Incrementality
Running a geo lift test by hand means building your own power calculator, chasing down pre-period RMSE by spreadsheet, and hoping your market matching holds up under scrutiny. Cassandra's geo-lift incrementality testing platform handles the market selection, power sizing, and iROAS reporting automatically, so your team spends its time interpreting results instead of building infrastructure to get them.

If you're planning a test for an upcoming channel decision, visit the incrementality testing platform to see how the automation maps to your current markets, or request a walkthrough to review your specific test design before you commit budget.
Sources
For deeper technical grounding, review GeoLift's open-source methodology and the practical geo-lift framework from d-dat covering design-to-analysis workflows.
- GeoLift Methodology
- Geo-Lift Testing 2026: A Practical Incrementality Framework · d-dat
- Geo-Lift Testing: How to Measure What Platforms Can't | QRY
- Geo-Lift Test: Definition — Fairview