

An executive marketing dashboard is a one-page, decision-ready view that links marketing spend to pipeline and revenue so CMOs can make faster, higher-confidence resource decisions. It works only when metrics like pipeline linkage and spend-to-revenue mapping replace vanity numbers, and when validated measurement techniques such as marketing mix modeling anchor the figures leadership sees. Some marketing measurement platforms build this discipline into their dashboard outputs directly.
TL;DR:
- Heavy emphasis should be placed on validated measurement methods like incrementality testing and marketing mix modeling to ensure accurate channel contribution signals.
- The dashboard should feature six to eight core KPIs, including marketing-sourced pipeline percentage, blended CAC, CAC payback period, and LTV to CAC ratio, with clear thresholds for action.
- Layout design must prioritize decision-making, with a scorecard, pipeline funnel, channel impact, and a narrative row for actionable insights, avoiding clutter and unnecessary detail.
- Data sources need to be confirmed and metrics definitions locked in, with automated refreshes and clear ownership to maintain trust and accuracy over time.
- The most effective dashboards combine real-time operational alerts with periodic strategic updates, tailored to the roles of CEO, CFO, and CMO, and restricted by role-based access for sensitive data.
Table of Contents
- What Are the Core KPIs on an Executive Marketing Dashboard?
- What Should a CMO Dashboard Layout Actually Look Like?
- How Do You Keep an Executive Dashboard Decision-Ready?
- How Do You Build an Executive Marketing Dashboard From Scratch?
- Why Does Validated Measurement Make Dashboards More Reliable?
- What Are the Biggest Obstacles to Maintaining an Executive Dashboard?
- Should Executive Dashboards Update in Real Time or on a Schedule?
- How Should a Dashboard Change for the CEO, CFO, and CMO?
- What Security and Governance Rules Apply to Executive Dashboards?
- Why Do Executives Need One Unified View Instead of Multiple Reports?
- How Do You Connect an Executive Dashboard to CRM, Sales, and Finance Systems?
- The Playbook Most CMOs Get Backward
- Turn Your Dashboard Numbers Into Numbers You Can Defend
- Sources
- FAQ
What Are the Core KPIs on an Executive Marketing Dashboard?
Board-level reporting runs on unit economics, not campaign minutiae. CMO dashboards tend to feature marketing-sourced pipeline percentage, blended CAC, CAC payback period, and LTV:CAC because these numbers defend budget requests in language finance and the CEO already understand.
A few of these deserve specific thresholds, not just definitions:
- Marketing-sourced pipeline %: the share of active pipeline that marketing generated or influenced; a low percentage usually signals a sales-led motion where marketing spend needs to be reallocated toward enablement, not demand generation.
- Blended CAC: total spend divided by new customers across all channels; rising CAC without a matching LTV increase is the clearest early sign of budget waste.
- CAC payback period: months needed to recover acquisition cost from gross margin; a long payback period in a subscription business usually triggers a hard look at channel mix.
- LTV:CAC ratio: a relatively low ratio typically means growth is being bought rather than earned.
- Funnel velocity and stage leakage: how fast deals move and where they stall, which tells you whether a pipeline problem is a volume problem or a conversion problem.
Pro Tip: Never report last-click ROAS next to these unit economics without a caveat. Attribution-only ROAS regularly overstates or understates channel value, because it ignores what would have happened without the spend. Channel contribution should always sit alongside an incrementality signal, not replace one.
What Should a CMO Dashboard Layout Actually Look Like?
Most executive dashboards fail not because the data is wrong, but because the layout buries the decision under decoration. A working layout follows a repeatable sequence:
- Scorecard strip: the six to eight core KPIs with trend arrows and a one-line "next action" callout next to each. This is the only section a CFO glancing over your shoulder needs to see.
- Funnel and pipeline strip: stage counts, conversion percentage between stages, velocity, and where leakage concentrates. This strip answers "where is the problem?" while the scorecard answers "is there one?"
- Channel impact view: spend mapped against pipeline value and bookings, with an incrementality or lift indicator flagging which channels are proven drivers versus merely correlated ones.
- Narrative row: two lines, "what changed this period" and "recommended action." This row does more work than any chart on the page, because it forces someone to interpret the data before the meeting starts.
Template galleries from vendors like Qlik are a reasonable starting point for the visual scaffolding. However, the narrative row is what turns a report into a decision tool.
How Do You Keep an Executive Dashboard Decision-Ready?
A dashboard earns its place on a CMO's laptop when every number on it maps to a choice someone is actually going to make. Design discipline matters more than visual polish here.
- Cap the executive view at six to eight metrics. Anything more turns into a scroll, and scrolling kills the one-page promise.
- Attach a decision to every metric. If a KPI can't answer "so what do we do differently," cut it.
- Keep period comparisons and layout structure stable quarter over quarter, so leadership pattern-matches instead of relearning the page.
- Name a single source of truth and an owner for each metric definition, because two teams reporting different CAC numbers erodes trust in the whole dashboard faster than any bad quarter does.
Pro Tip: Build fast drill-downs behind each top-line number, but don't put them on the executive page itself. The CMO wants the headline and a one-click path to the detail, not the detail by default.
Guidance on leadership-facing reporting consistently points to this pattern: a small set of recurring views, period-over-period context, and a short "what changed" narrative outperform dense, catch-all reports every time.
How Do You Build an Executive Marketing Dashboard From Scratch?
Standing up a reliable dashboard is a sequencing problem before it's a design problem.
- Inventory your data sources. CRM, finance systems, ad platforms, web analytics, and any attribution or measurement layer all need confirmed connectors before you design a single chart.
- Lock metric definitions in writing. Document exactly how CAC, pipeline percentage, and LTV are calculated, and pick one source table per metric.
- Set cadence by audience. Weekly views drive tactical direction; monthly or quarterly views feed the board. Assign a named owner to each cadence.
- Automate the refresh. Manual pulls are where "different numbers" problems start; automating refreshes and assigning ownership cuts prep time and closes the door on conflicting figures.
- Validate with sample checks. Run a lightweight incrementality or A/B check against your channel numbers before leadership sees them.
- Train the room. Walk leadership through how to read the page and how the "next action" prompt is supposed to trigger a real decision, not just a nod.
Why Does Validated Measurement Make Dashboards More Reliable?
A dashboard is only as trustworthy as the attribution logic feeding it, and last-click models routinely overcredit bottom-funnel channels while starving the upper funnel of budget it deserves. Incrementality testing isolates the causal lift a channel actually produces by comparing exposed and unexposed groups. Marketing mix modeling adds the broader context, quantifying how media investments interact across the full channel mix over time.
Cassandra's incrementality testing approach exists specifically because attribution-only signals mislead budget decisions at the exact moment CMOs need confidence, not correlation. In practice, these two methods complement each other well: incrementality confirms near-term causal impact, while MMM supplies the mix-level view, and both feed cleaner channel contribution numbers into the dashboard itself.
- Incrementality testing answers: "did this specific spend actually cause the lift?"
- MMM answers: "how does this channel perform relative to every other channel, over a longer window?"
- Together, they replace guesswork on the channel impact strip with numbers a CFO will actually accept.
What Are the Biggest Obstacles to Maintaining an Executive Dashboard?
The hardest part of dashboard work isn't the build. It's keeping the thing trustworthy six months later. Three problems show up repeatedly.
Definition drift. Marketing calls a lead "qualified" one way, sales calls it another, and finance uses a third definition for revenue recognition. The fix is a written metric glossary with one owner per definition, reviewed quarterly rather than left to informal memory.
Data source sprawl. New ad platforms, a CRM migration, or a new analytics tool each introduce a connector that can silently break a metric. Assign someone to audit connector health monthly, not just when a number looks wrong.
Dashboard fatigue. Leadership stops opening a report that's stayed static for a quarter, or stops trusting one that's changed shape four times in six months. The layout needs to stay stable while the underlying data stays fresh, which means resisting the urge to redesign every time someone has a new chart idea.
A fourth challenge is subtler: dashboards that look finished tend to stop getting questioned. Build in a standing quarterly review where someone explicitly checks whether the current six to eight metrics still map to the decisions the business is actually making.
Should Executive Dashboards Update in Real Time or on a Schedule?
The honest answer is both, applied to different rows on the same page. Real-time data earns its place on operational signals: campaign pacing, spend velocity, and anomaly flags that need same-day attention. Waiting a week to notice a tracking pixel broke, or that a channel is burning budget three times faster than planned, costs real money.
Periodic updates, usually weekly or monthly, fit the metrics that drive strategic decisions: CAC trends, LTV:CAC, pipeline contribution, and channel-level incrementality reads. These numbers need enough data volume to be statistically meaningful, and refreshing them hourly just introduces noise that leadership mistakes for signal.
The practical failure mode goes both directions. Teams that force everything into real time end up with jittery charts that make a CMO chase noise between board meetings. Teams that batch everything monthly miss budget-burn problems that a same-day alert would have caught in hours instead of weeks.
The fix is a tiered cadence, not a single answer: real-time alerts for pacing and anomalies, weekly refreshes for tactical channel views, and monthly or quarterly locked snapshots for the board-facing scorecard. Locking the board view matters more than it sounds. A number that shifts between when the board sees the deck and when they ask a follow-up question destroys credibility fast, even if the shift reflects genuinely better data.
How Should a Dashboard Change for the CEO, CFO, and CMO?
The same underlying data supports very different views depending on who's reading it, and building one dashboard for all three roles is a common mistake.
CMO dashboards typically emphasize aggregated, outcome-focused metrics rather than tactical channel KPIs, which stay on manager-level operational dashboards instead. A CMO wants pipeline contribution, CAC trends, and channel-level incrementality, all tied to the next budget conversation.
A CFO reads the same underlying numbers through a cash and efficiency lens: CAC payback period, LTV:CAC, and how marketing spend tracks against the approved budget, with far less patience for engagement metrics that don't touch revenue.
A CEO wants the fewest numbers of the three, usually just growth rate, marketing-sourced pipeline percentage, and a single confidence signal on whether spend is producing the return the board expects.
Practically, this means building one validated data layer and three thin views on top of it, not three separate reporting pipelines. Keep metric definitions identical across all three so a CFO and a CMO are never disagreeing about the same number, only about which numbers matter most for their seat at the table. Filter, don't fork.
What Security and Governance Rules Apply to Executive Dashboards?
Executive dashboards concentrate sensitive information in one place: revenue figures, customer acquisition costs, and often unreleased financial targets. That concentration raises the governance stakes above a typical marketing report.
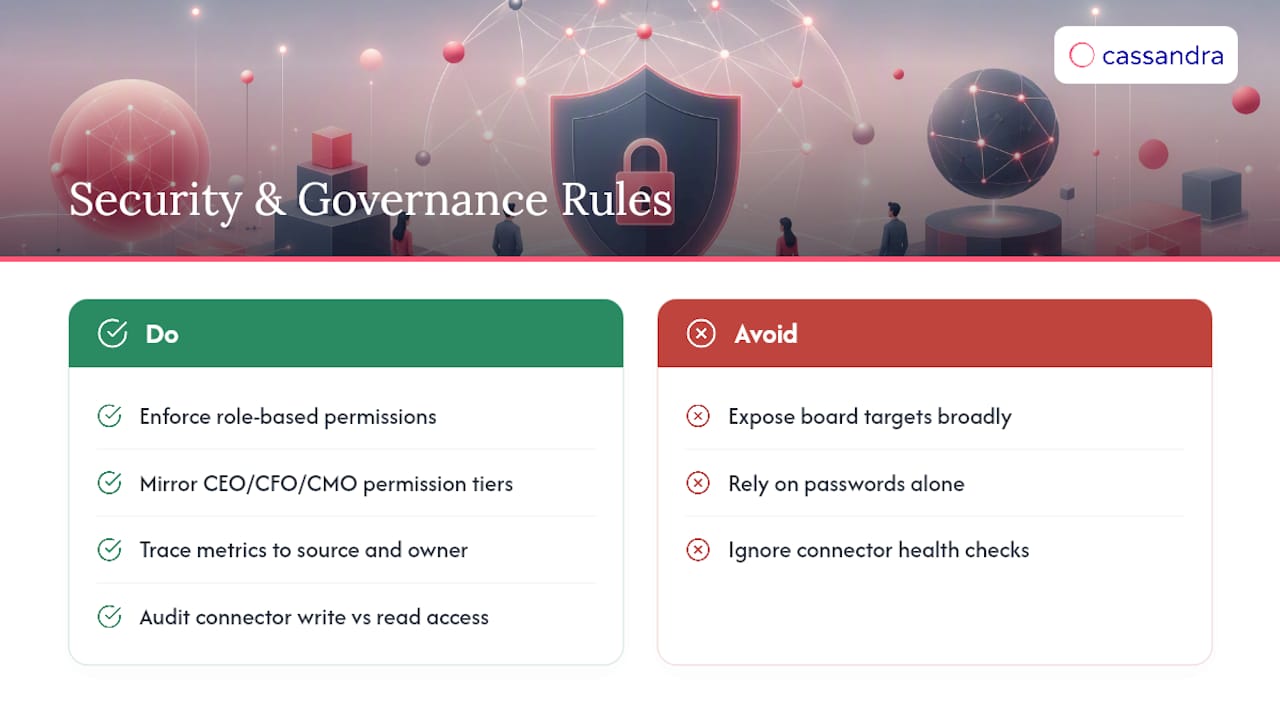
Access control needs to be role-based, not just password-protected. A regional marketing manager rarely needs visibility into board-level revenue targets, even if their campaign data feeds into the same dashboard. Permission tiers should mirror the CEO, CFO, and CMO views already discussed above, restricting sensitive financial rollups to the people who need them.
Data lineage matters as much as access. Every number on the executive page should be traceable back to its source table and its owner, both so leadership can trust the figure and so a compliance review can reconstruct how it was calculated. This is the same source-of-truth discipline that prevents conflicting numbers, doing double duty as a governance control.
Third-party connectors, particularly ad platform and CRM integrations, are the most common point of exposure. Audit which tools have write access versus read-only access, and review that list on the same cadence as the connector health check. A dashboard vendor with strong measurement credentials but loose data handling is still a liability leadership needs to weigh before rollout.
Why Do Executives Need One Unified View Instead of Multiple Reports?
Every extra report a CMO has to reconcile before a board meeting is time not spent deciding anything. Fragmented reporting, one export from the ad platform, another from the CRM, a third from finance, forces someone to manually reconcile numbers that should have agreed in the first place.
A single unified dashboard removes that reconciliation step entirely, and the time savings compound. Vendor case data on template-driven executive views with export-ready metrics and a built-in "what changed" narrative reports a measurable reduction in board prep time once teams adopt a one-page format instead of assembling reports from scratch each cycle.
The unification also changes the quality of the conversation, not just its speed. When a CMO can point to one page and say "pipeline contribution dropped because channel X lost incremental lift," the board discussion moves straight to the decision instead of relitigating whose numbers are correct. One useful test before a board rollout: pilot the unified view with a single product line or geography first, and track time-to-decision and the number of follow-up data requests that come back afterward. A dashboard that's actually working generates fewer follow-up requests over time, not more.
How Do You Connect an Executive Dashboard to CRM, Sales, and Finance Systems?
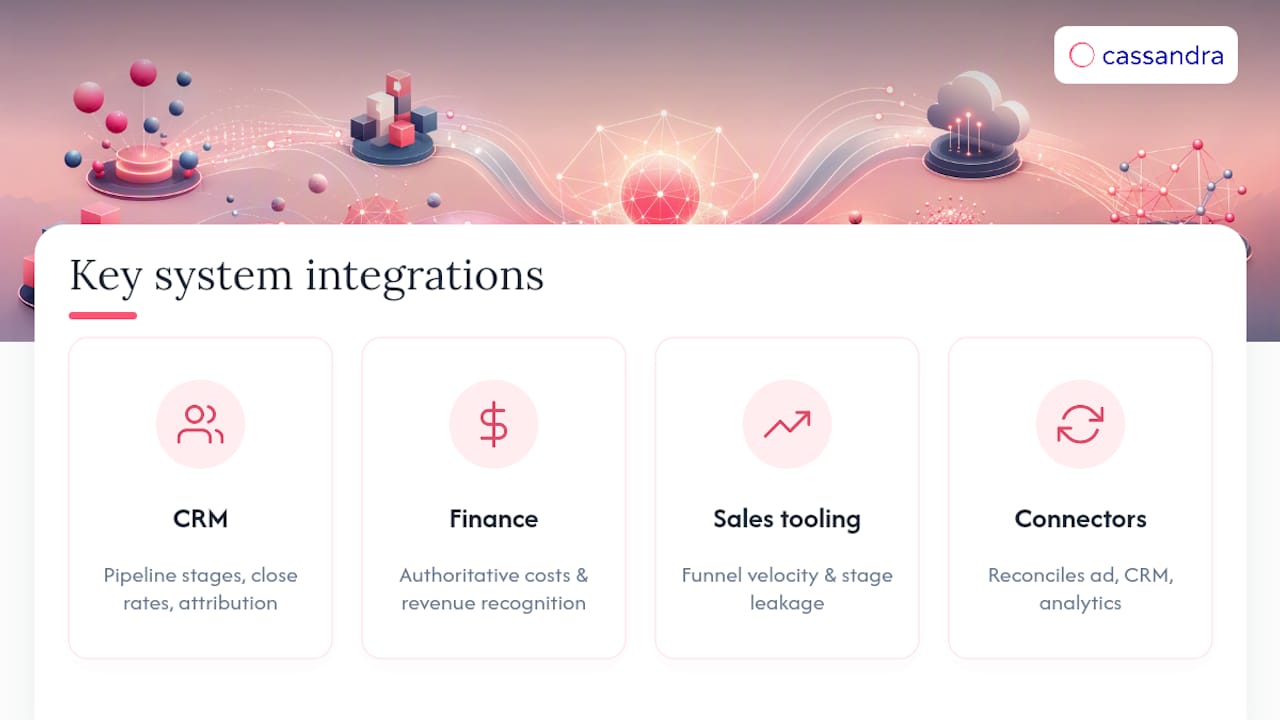
Pipeline and revenue numbers only mean something on a marketing dashboard when they're pulled directly from the systems of record, not recreated from marketing's own estimate of what closed.
CRM integration is the most critical connection, since it's the source for pipeline stage counts, close rates, and marketing-sourced revenue attribution. Without a live CRM feed, marketing ends up reporting a version of pipeline that sales doesn't recognize, which is one of the fastest ways to lose credibility with the CFO.
Finance system integration matters just as much, particularly for CAC and LTV calculations that depend on accurate cost data and revenue recognition rules finance already owns. Marketing shouldn't be estimating gross margin independently when finance has the authoritative number.
Sales tooling, whether that's a dedicated sales engagement platform or fields inside the CRM itself, feeds funnel velocity and stage leakage data that marketing can't generate on its own. The integration point that most teams underestimate is timing: batch syncs that run once a day are fine for board-level metrics, but funnel velocity readings lose value if they're a day behind an active sales cycle.
Connector approaches that pull from ad platforms, CRM, and analytics sources into a consolidated attribution view help dashboards reflect one reconciled dataset instead of three disconnected exports.
The Playbook Most CMOs Get Backward
Most advice on executive dashboards starts with layout: pick a template, choose your charts, ship it. That sequencing is exactly backward, and it's why so many dashboards look polished in the first board meeting and get ignored by the third.
The layout is the easy part. The hard part, the part that determines whether leadership trusts the page six months from now, is whether the numbers feeding it survive scrutiny. A channel contribution chart built entirely on last-click attribution will eventually get challenged by a CFO who's noticed spend keeps rising without a proportional revenue lift, and at that point no amount of chart redesign saves the dashboard's credibility.
Get the measurement right first. Run incrementality tests on your top two or three channels before you finalize what goes on the channel impact strip. Layer in marketing mix modeling once you have enough historical spend data to make it meaningful. Only then build the one-page view around numbers that will hold up when someone in the room asks a hard follow-up question.
The reader who takes one thing from this: prioritize measurement validation over dashboard aesthetics. A less pretty dashboard built on incrementality-tested numbers beats a beautifully designed one built on attribution alone, every time it gets tested in a real budget conversation.
Turn Your Dashboard Numbers Into Numbers You Can Defend
A dashboard is only as strong as the measurement behind it, and some platforms aim to close the gap of last-click attribution problems by pairing multi-channel measurement, incrementality testing, and marketing mix modeling to help ensure channel contribution numbers are validated, not just visualized.
That matters directly for the implementation checklist covered earlier: such connectors can plug into CRM, ad platforms, and finance data to feed a single reconciled attribution layer, maintain consistent metric definitions across CEO, CFO, and CMO views, and allow incrementality and MMM outputs to slot into the channel impact strip on a one-page scorecard. Some clients across ecommerce, nonprofit, and travel sectors have used this approach to plan investments with less budget waste and stronger returns.
If you're rebuilding or validating your executive dashboard this quarter, review marketing measurement use cases to see how connectors and measurement outputs can map to your current setup, and consider requesting a walkthrough of what a validated channel view looks like against your own data.
Sources
- Executive Marketing Dashboard | ROI, Pipeline & Funnel Health with RevSure
- Executive Dashboard for Leadership Decisions | Fusedash
FAQ
What should be on an executive marketing dashboard?
A working executive dashboard includes six to eight core metrics: marketing-sourced pipeline percentage, blended CAC, CAC payback, LTV:CAC, funnel velocity, and channel contribution backed by an incrementality signal, plus a short "what changed" narrative row.
What are some examples of marketing dashboards?
Common layouts include a single-page executive scorecard with trend arrows, a funnel and pipeline strip showing stage conversion and leakage, and a channel impact view mapping spend to pipeline value; template galleries offer a useful starting structure for each.
How do you create a dashboard for leadership reporting?
Start by inventorying your data sources and locking metric definitions in writing, then set a cadence, assign metric owners, automate refreshes, and validate the numbers with sample-level incrementality or A/B checks before leadership sees the page.
What are the four types of dashboards?
Reporting generally splits into operational (day-to-day execution), analytical (deep-dive investigation), strategic (executive and board-level), and tactical (departmental) dashboards; an executive marketing dashboard falls squarely into the strategic category.
How does a marketing measurement platform fit into an executive dashboard build?
Such platforms can supply a validated measurement layer, incrementality testing, and marketing mix modeling that feed accurate channel contribution numbers into the dashboard, replacing attribution-only signals that tend to mislead budget decisions.